
School test scores in DC are again in the news as the Mayor relied heavily on National Assessment of Education Progress results in his State of the District address and critics responded.
Knocking One Out of the Park?
On March 11, DC mayor Vincent Gray gave a State of the District address, applauding school improvements under his administration. He noted that DC Public School scores have risen on the National Assessment of Educational Progress – the NAEP – faster than the scores of other jurisdictions. He quoted a recent shout-out highlighting DC’s accomplishment at a gathering of the U.S. Conference of Mayors:
President Obama’s Secretary of Education Arne Duncan said of these results – and I quote – “Mayor Gray and D.C. knocked the ball out of the park.” That’s good news for the District’s children indeed. They knocked it out of the park! And I could not be more proud of them.
— Gray’s 3/11 speech (See below for Duncan’s remarks)
In addition, Gray touts DC’s ranking improvement in the Trial Urban Data Assessment (TUDA). His remarks on this begin as follows: “The TUDA is a test that compares urban school districts across the nation, so it is a true apples-to-apples comparison.” This suggests that he and his office believe the TUDA is a test administered to big-city students. In reality, it’s a new analysis of the existing NAEP scores comparing the same testing data from big cities. But perhaps his speech writers meant something else.
Following Arne Duncan’s January remarks — can’t find Duncan’s full speech, but here is his letter to the Post — a number of articles appeared in response, including several in the Washington Post in response. Former publisher Donald Graham used Duncan’s praise and the NAEP scores themselves to criticize DC Councilmembers for failing to support current schools Chancellor Kaya Henderson (February 24). David Catania, chair of the DC Council’s Education Committee, then responded to Graham in print (March 7; Catania has since declared his candidacy for mayor). Catania’s response included statistics Duncan didn’t stress. For example, in 2013 only 49.7 percent of African American males graduated on time, while 88 percent of their white peers did so.
I am not satisfied with progress that does not reach low-income and minority students. And I do not believe that this is merely an area in need of improvement. This is an emergency.
–David Catania in the Post
Or Headed for a Fall?
Weeks earlier, mayoral candidate Andy Shallal released an education white paper. He called first and foremost: “Stop the fixation with the standardized test metric.” He goes on to cite deeper analysis of the same data Duncan and Gray and Graham have been celebrating: “The income gap has seriously widened under the current ‘reform regime.'” Similarly, the testing performance gap between students labeled “black” and those labeled “white” has grown in the same data celebrated as “knocking one out of the park” for reform.
Following Gray’s remarks on Tuesday, additional criticisms emerged, referencing Shallal’s white paper: Valerie Strauss, of the Washington Post – who was invited to join the Education Town Hall on March 13 but had another obligation – published several graphs March 12 that seem to say it all. (Similar graphs appear with Shallal’s white paper — also see radio play-by-play below).
radio play-by-play
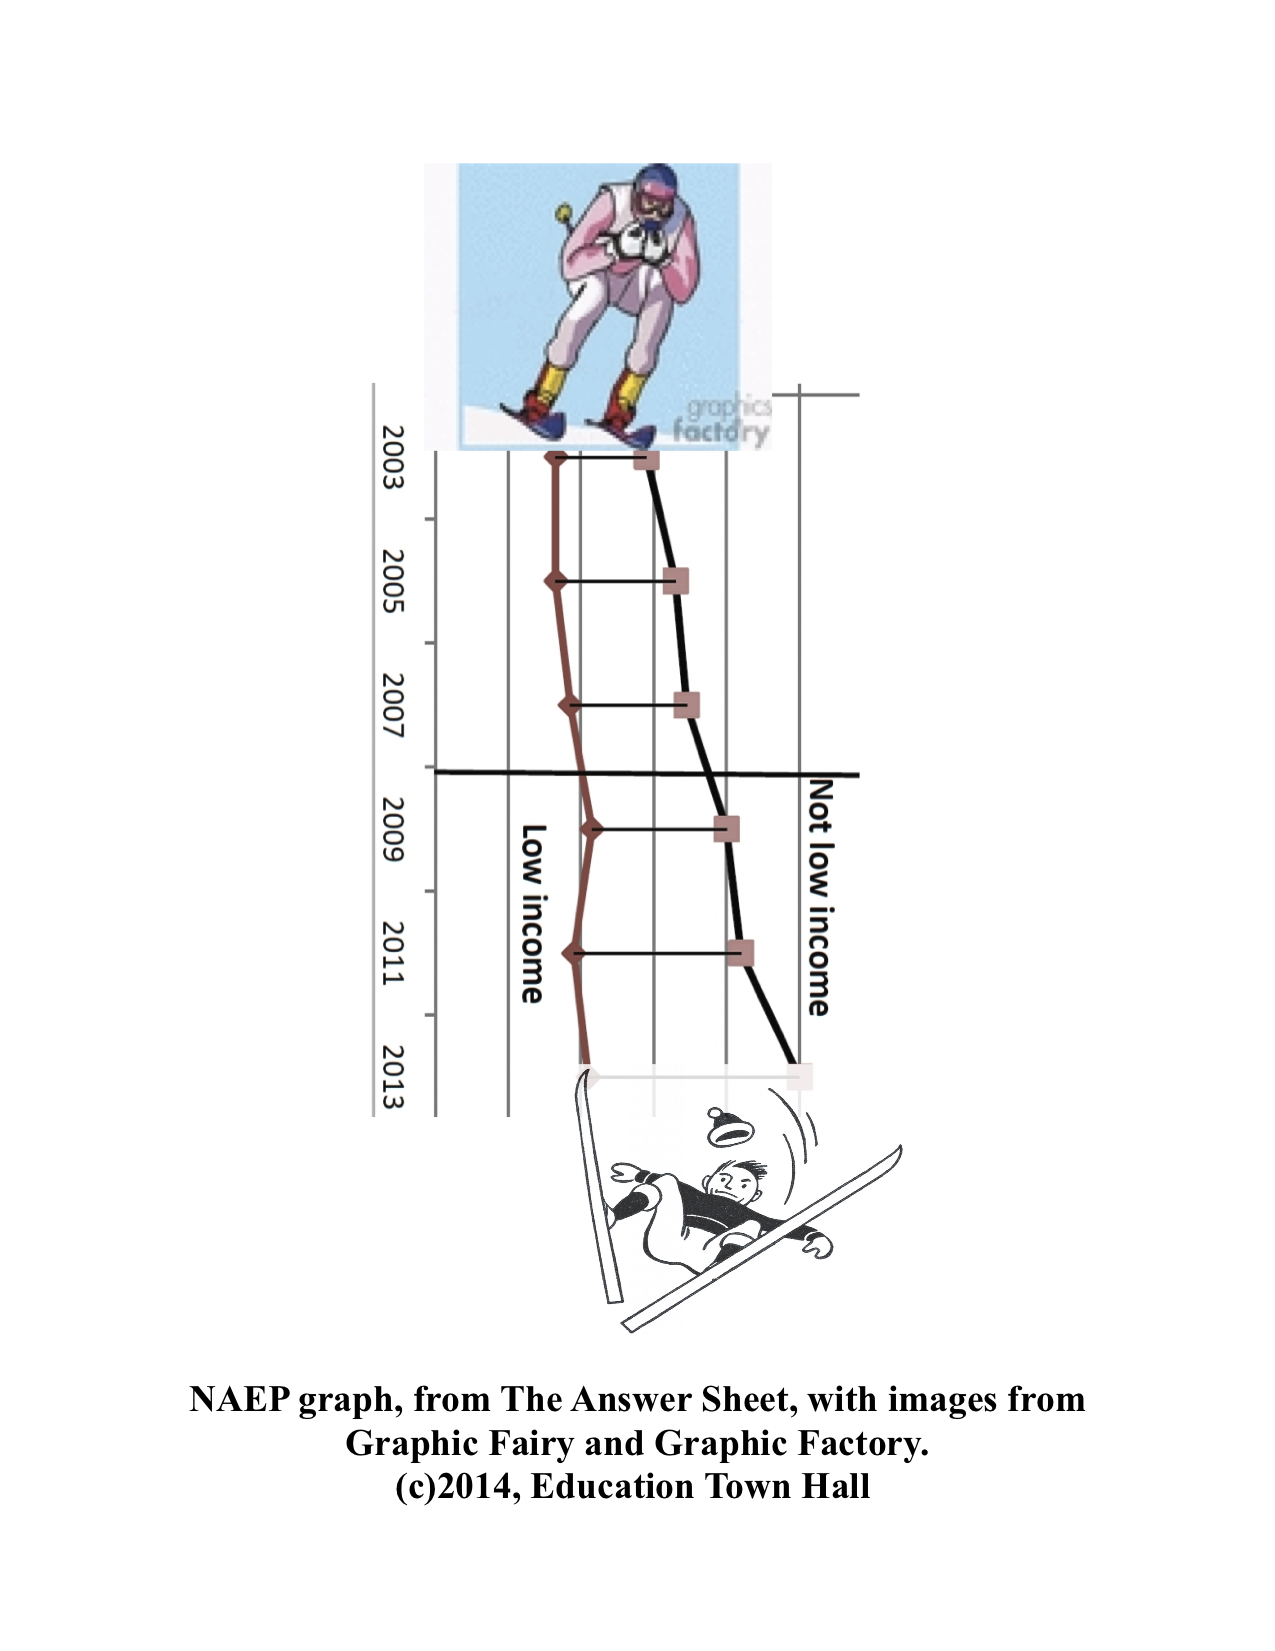 A skier starts on a slope from 2003 4th-grade reading scores, heading toward 2013 scores. The skis — one representing higher income students and one representing lower income students — stay roughly the same distance (30 or 40 points) apart until 2007. Then, the low income leg remains steady — scoring between 180 and 190 — while the higher in come ski veers off — from 210 or so toward 250. The widening distance between the skier’s legs will soon lead to a fall. A skier representing 4th grade math scores and reading and math scores at the 8th grade level would meet the same split-induced fate.
To consider the scores by race/ethnicity it might help to imagine the 8th grade math proficiency scores of white students as a redwood tree — at just over 70% — while the scores of Hispanic students are an elm, at 20%, and those of black students a tall shurb at below 10%. Low-income black students score in the range of a shorter bush. (Examples not necessarily to scale.)
In his State of the District address, Gray notes briefly that “we aren’t yet where we need to be.” But he says nothing specific about the gaping achievement gaps in DC’s testing results. He claims his administration is not looking through rose-colored glasses, but perhaps it’s a question of angle.
Listen to the Full Discussion
Mary Levy joined the March 13 Town Hall to discuss the Answer Sheet graphs, which she helped create by extracting DCPS data from the NAEP results. Conversation with Levy also included budgets, truancy and suspension statistics, and a variety of related topics. Charles Allen, candidate for Ward 6 member of the DC City Council, joined the discussion
Listen here.
The Education Town Hall airs weekly at 11 a.m. eastern on We Act Radio, broadcasting from Historic Anacostia in Washington DC.
Via TuneIn from anywhere in the world — or on WPWC, 1480 AM in the DC area — from 11 to noon, or listen later via our archives.

3 comments